
Debug Button
Debug button on the Flow Builder can be used to test a new flow or troubleshoot a flow that fails. Using this button, you can see real-time details of what your flow does, easily set input variables, and restart the flow anytime to debug a different branch.
It is important to keep in mind that debugging a flow runs the flow and all the actions will be performed, which means debug button doesn't test the flow but it really runs it.
In order to debug a flow, open the flow in Flow Builder and click on the Debug button.

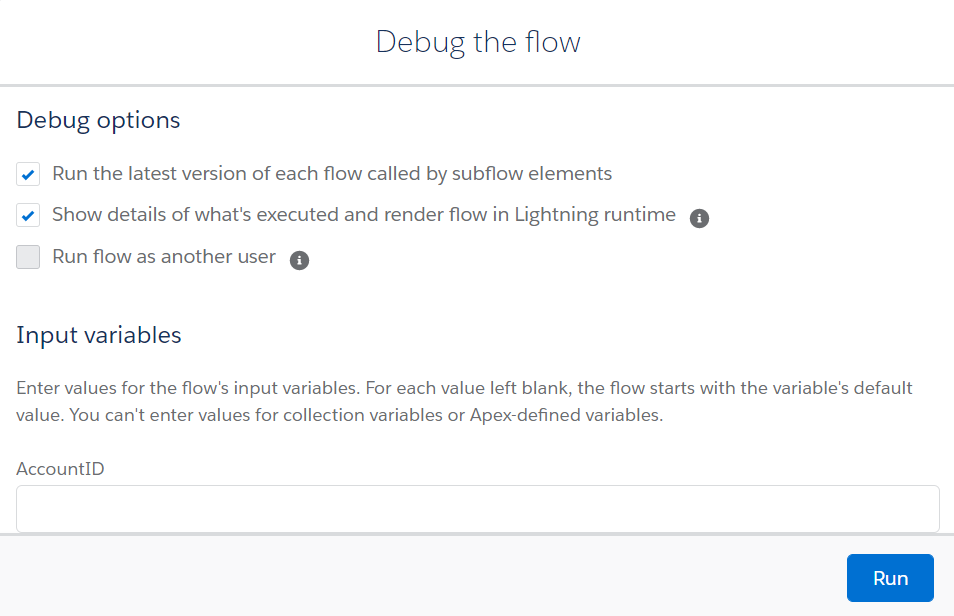
After clicking the Debug button, a popup will be opened on a new page. From this button, you can decide to run the latest version of each flow called by subflow elements, show details of what's executed and render flow in Lightning runtime, and run the flow as another user.
If you mark to show the details of what's executed, then it will show you the details of each step on the right side of the screen, which is the main purpose of debugging.
To be able to run a flow as another user, you have to enable this feature first. To do so, go to Process Automation Settings in setup and mark "Let admins debug flows as other users". When this setting is enabled, users with the Manage Flow and View All Data permissions can specify the running user each time they debug a flow.
After marking/unmarking the debug options, you can enter values for the flow's input variables. For each value left blank, the flow starts with the variable's default value. You can't enter values for collection variables or Apex-defined variables. Variables that you will see in the Input Variables section are the variables that defined as input.
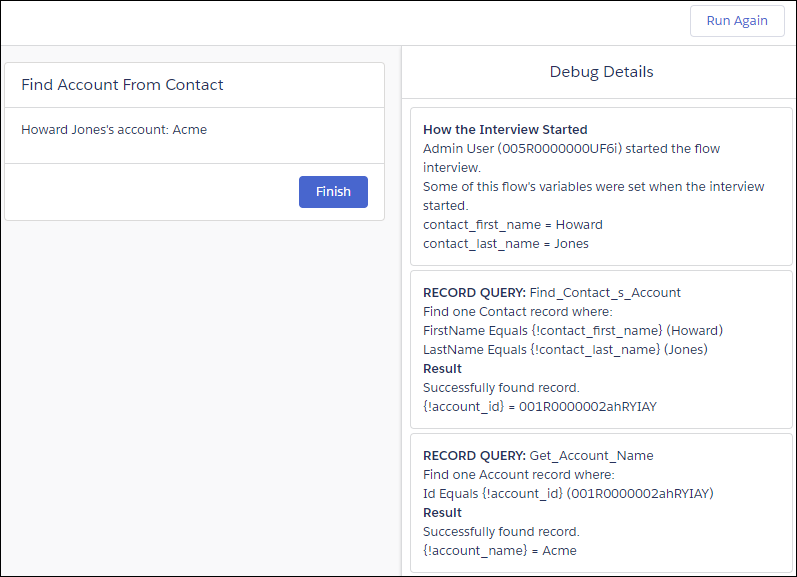
After clicking Run, flow starts running with the parameters that you provide and on the right side of the screen, it is possible to see the actions step by step.
To restart the flow using the same values for input variables that you entered earlier, click Run Again. To restart the flow with different values for input variables, finish the flow and click Change Inputs.
Even though the debug button is visible on all types of flows, debugging is not possible for the record triggered flows. However, it will be possible in the upcoming releases.
Debug on Canvas Button
Debug on Canvas is a new beta feature that lets you see the path your flow takes when debugging an autolaunched, non-triggered flow. It means that this button is available only for autolaunched flows and not for screen flows or record triggered flows or scheduled flows.
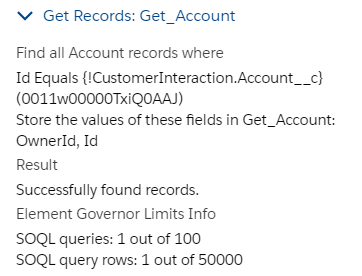
In Debug on Canvas (beta) in Flow Builder, you can view the debug run’s path and debug log side by side. You can also see how close your flow’s elements came to hitting SOQL query limits.
In order to debug your flow on canvas, open the flow in Flow Builder and click on Debug on Canvas button.

After clicking the Debug on Canvas button, a popup will be opened on the existing page. From this button, you can decide to run the flow as another user (if this feature is enabled), run flow in rollback mode, and show query limits in debug details.
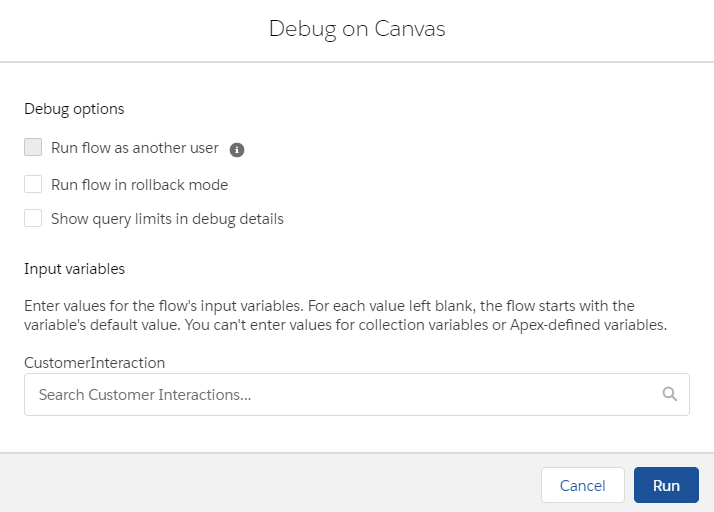
If you run the flow in rollback mode, all the DML operations will be rolled back, which means nothing will be changed in the database. This is a great feature because it lets you test the flow, otherwise there wasn't so much difference between debugging and running the flow.
If you mark "Show query limits in debug details", then an information about query limits will be displayed for each step on the debug.
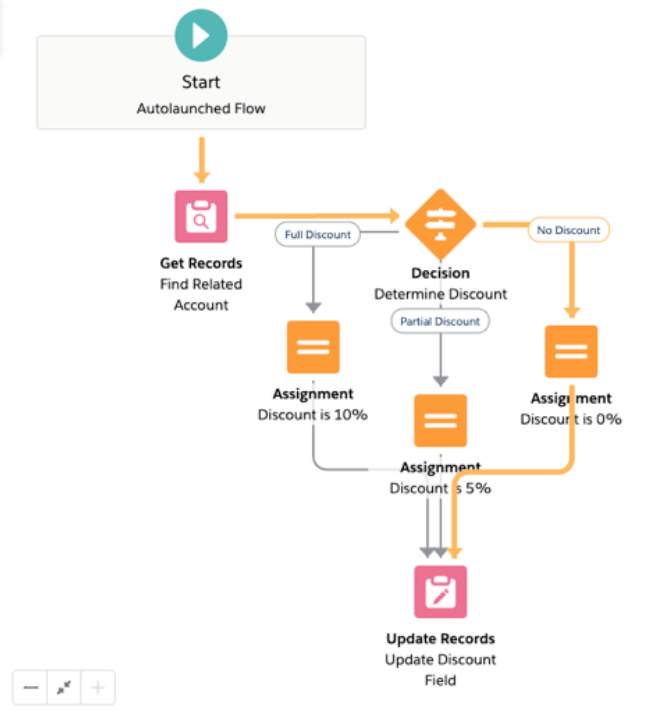
Each step can be seen on the canvas with orange lines. This way, it becomes easy for the user to understand which path the flow followed and how a record arrived at its failure point.
The flow master.
Haha thank you!