
Indicators help you emphasize key data by using icons and colors. They make it easier to concentrate on the most important information. For instance, adding a progress bar on Salesforce records can provide a clear visual representation of task completion. It helps users quickly assess progress and prioritize their efforts.
There are various ways to add a progress bar to Salesforce records. Let's look at an example of adding a progress bar to the Opportunity object to display the probability value.
Using a Formula Field to Display the Probability
There are multiple progress bar images available online. By using IF and IMAGE functions, you can display different progress bar images on an object. While this is an easy solution that works well for the probability field, it may not be the best option for other fields. For instance, what if a custom percentage field has a value of 11%? Will you have 100 different images to cover each possible value? And if your answer is yes, what will you do if the value is 11.3%? This approach is not scalable and therefore not a feasible solution.
Using Flow and Rich Text Field to Display the Probability
It is possible to use HTML to display a progress bar. Since rich text fields support HTML, you can build a record-triggered flow that updates a rich text field with a dynamic HTML code. Let's see how to build this solution.
1- Create a rich text field on the Opportunity object. Let's call it "Probability Indicator".
2- Create a record-triggered flow that runs when an Opportunity is created or when its stage changes.
3- Create a text template in plain text mode and enter this HTML code.
<div style="display: flex;">
    <div style="width: 100%; background-color: #f3f3f3; border: 2px solid #ccc;">
        <div style="height: 100%; width:  {!$Record.Probability}%; background-color: #4caf50; text-align: center; color: white;">
            <div style="width: 100%; font-size: 16px; font-weight: bold; color: black;">
                {!$Record.Probability}%
            </div>
        </div>
    </div>
</div>
4- In this HTML code, we have two bars: one gray and one green (color code #4caf50). To make the color dynamic, we will create a formula and use it as the color code.
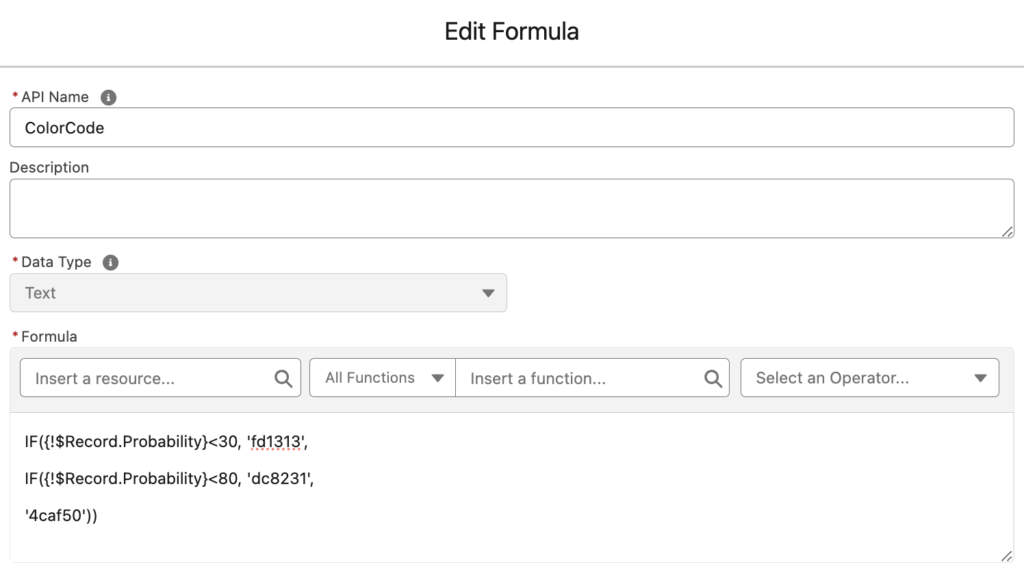
IF({!$Record.Probability}<30, 'fd1313',
IF({!$Record.Probability}<80, 'dc8231',
'4caf50'))
Your final HTML code (text template) should be like this.
<div style="display: flex;">
    <div style="width: 100%; background-color: #f3f3f3; border: 2px solid #ccc;">
        <div style="height: 100%; width:  {!$Record.Probability}%; background-color: #{!ColorCode}; text-align: center; color: white;">
            <div style="width: 100%; font-size: 16px; font-weight: bold; color: black;">
                {!$Record.Probability}%
            </div>
        </div>
    </div>
</div>
5- Add an Assignment or Update Records element to update the rich text field.
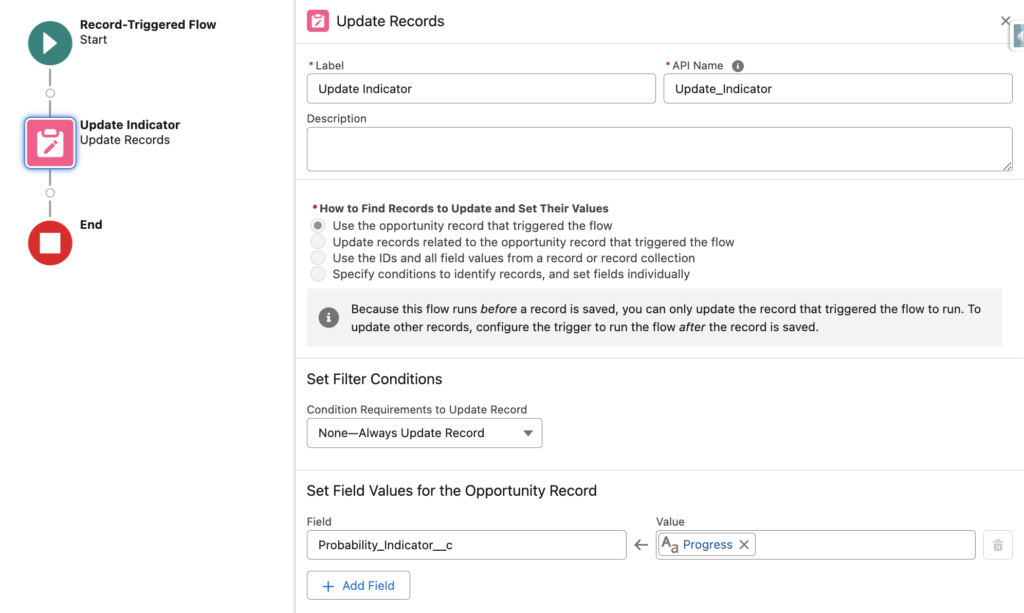
As you can see, it updates the progress bar once you change the stage. Since the value is not hardcoded, it supports all probability values, making it dynamic and scalable.
Although it is a dynamic and scalable solution, rich text fields have some limitations that you may need to consider. For instance, it is not possible to add this field to the compact layout.
Using a Formula Field to Add a Dynamic Progress Bar
As we saw before, displaying different progress bar images is not a scalable solution. This is because we cannot have different images for all the possible values. However, it is possible to build the progress bar dynamically rather than relying on images. This approach was proposed by Joel Kaufman. Let's explore how we can implement this solution.
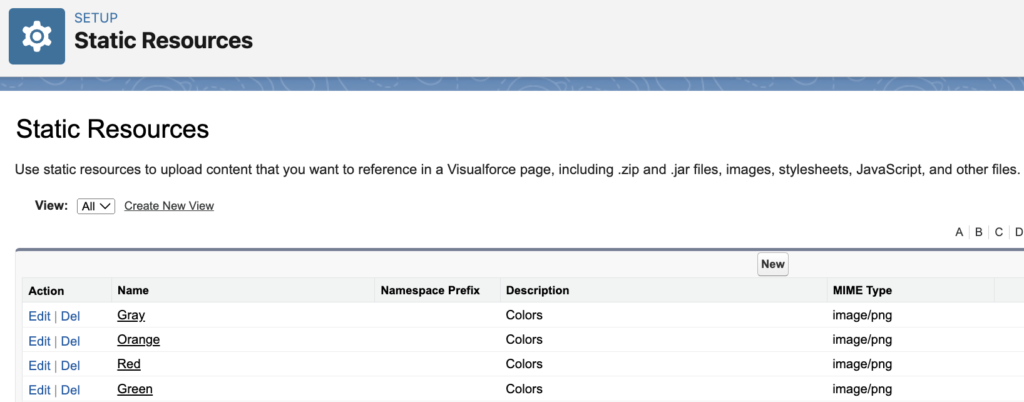
1- We will build a progress bar that displays multiple colors (gray, red, orange, and green). Let's add these colorful squares to static resources.


2- Create a text formula field on the Opportunity object.
IF(Probability<0.3, IMAGE('/resource/Red', '', 20, 100* Probability),
IF(Probability<0.8, IMAGE('/resource/Orange', '', 20, 100* Probability),

IMAGE('/resource/Green', '', 20, 100* Probability)))

& IMAGE('/resource/Gray', '', 20, 100* (1-Probability))
& ' '& TEXT(100*Probability)&'%'
If the probability is less than 30%, it displays a red square with a height of 20px and a width of 100 * Probability pixels (for example, 20px to 25px). The remaining part of the progress bar should be gray. Therefore, it displays the gray square with a height of 20px and a width of 100*(1-Probability) (for example, 20px to 75px). The total width of both of the bars make 100px. It follows the same logic for orange and green too. You can scale these dimensions as needed for a larger progress bar. Finally, the probability value is shown as text.
Unlike the solution using a rich text field, it is possible to add the progress bar/indicator to the compact layout. Moreover, there is no need for a flow to update the bar. However, there are some disadvantages too. Since it is just a formula field, it has limitations. For example, you cannot make the text bold and it is not possible to apply HTML tags.
Leave a Reply